
Case studies
See how we turn operations data into decisions
Worked examples of the data pipelines, dashboards, and analysis we build. Each one is a demonstration project built on sample data, so you can see how we work before we work together.
Case study 01
Order fulfillment performance for a distribution center
The challenge
Fulfillment data lived inside the WMS, so seeing performance meant exporting reports by hand and stitching them together in spreadsheets.
What we did
We connected and cleaned the WMS data, then built an interactive Tableau dashboard the whole team can trust.
What you can see
Orders, revenue, units sold, and discounts, broken down by product, fulfillment center, and location, trended against last year.
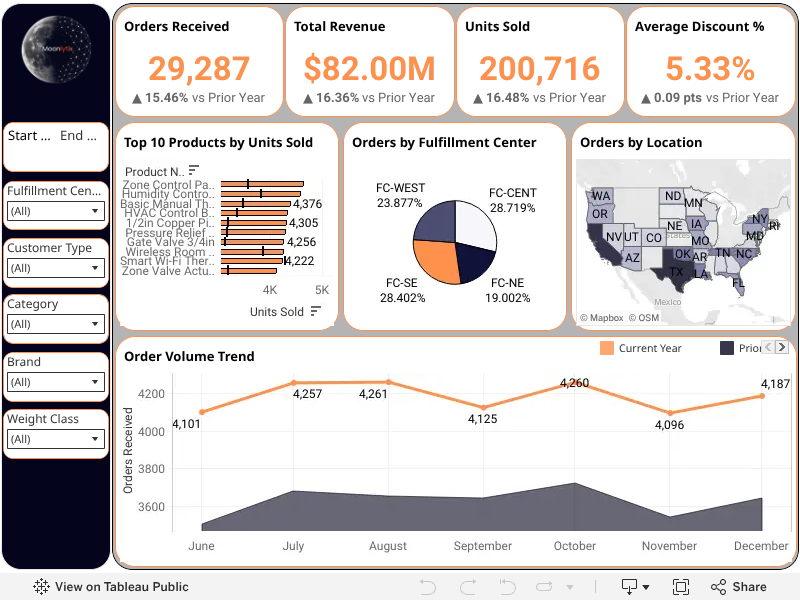
This dashboard is interactive and works best on a larger screen. Open it in Tableau to explore every chart and filter.
View the full dashboard
Demonstration project built on sample data modeled on a typical WMS. Hover, click, and filter the dashboard to explore it.
Coming next
More case studies on the way
Choosing where a distribution center should be
Using order volume by region to find the best location and test consolidating warehouses.
Forecasting demand for a seasonal product line
A model trained on sales history and seasonality to plan inventory and reduce stockouts.
Automating a weekly operations report
Replacing hours of copying data between systems with an automated report.
Comparing carriers before a contract renewal
Benchmarking carrier cost and delivery performance to negotiate with real data.
Want to see this on your own data?
Book a short call and we will show you how a dashboard like this could work for your operation.